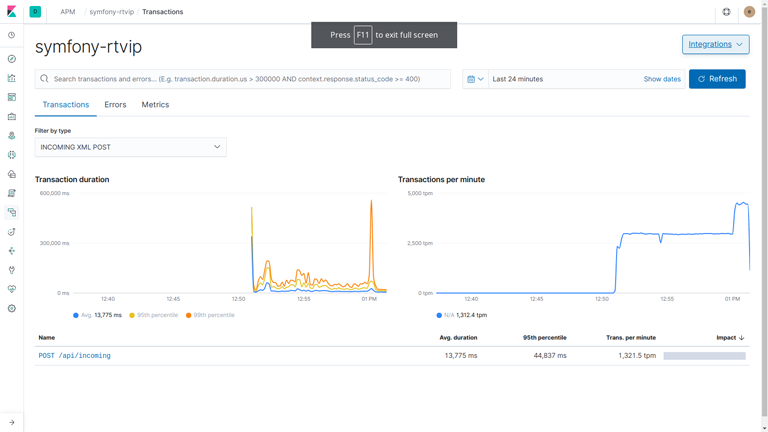
Real-time Application Metrics
Our design philosophy includes incorporating an APM Agent directly within the application code from the beginning of design conception. The key benefits are knowing in detail what is happening inside the codebase without the need to inspect debug or system logs. Application performance monitoring means detailed information about processes, invalid data values, warnings, errors, and exceptions.
Key Performance Indicators
Custom application metrics become the key performance indicators by reporting how many transactions per minute, the number of records, connections, successful and failure conditions, application health, and status checks. These data metrics result in incremental improvements in the overall performance and connection times to dependent infrastructure resources.
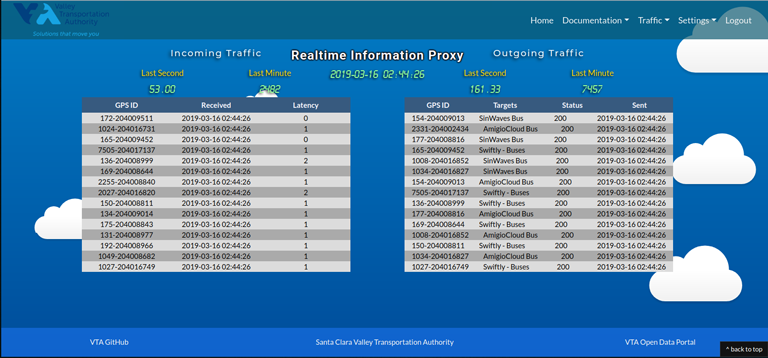
Dashboard Visualizations
We offer extensive experience in creating custom dashboards to monitor the health and performance of the application in an easy-to-understand visual format. For example, see the screenshot of the RTVIP application with regular traffic. If there are any error conditions like latency or an improper HTTP response, the rows will turn yellow and red, reporting the issue.
Performance Tuning and Optimizations
We incorporate application design principles using actual application and server metrics that identify system bottlenecks, throughput latency issues, and extreme memory conditions. We can improve performance by following a proven process of making small server and application changes based on the metrics and measuring the improvements.